At this point one usually resorts to some sort of logging. These logging statements are placed in strategic locations through the suspect code (at every other line.) If the bug is in the UI, the common method is MessageBox.Show. If the problem is in an underlying assembly, you must resort to writing output to a text file. The downside is that lots of message boxes wear you out, and it's always a pain tracking down the necessary code to write files.
An easier option is to call Trace.WriteLine (located in System.Diagnostics.) In my sample application (MyApp) I have a single button. Inside the Click event, I add the following line
Trace.WriteLine("Button1 was clicked");The event then calls a method in a separate library. In this library method, I've added the following line ('x' was the parameter passed into the method)
Trace.WriteLine("SomeMethod - Parameter x: " + x.ToString());When I run the application from VisualStudio and click the button, the Output window contains the trace messages

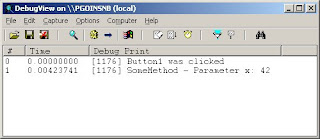
That's fine if you're running VS, but what about on a QA box? For that I'm using DebugView. After starting up the utility, I fire up the sample application. Click the button (which again calls Trace.Writeline) and DebugView displays the messages previously seen in Visual Studio.

No comments:
Post a Comment
Note: Only a member of this blog may post a comment.